JavaScript heap out of memory: leak, spike, or a limit set too low?
Restarting the process fixes it every time, which is exactly why it keeps coming back. Here is how to read the crash, tell a leak from a spike from a limit set too low, and find what is actually holding the memory.
The API has been up for nine days. Then the process manager shows a restart, and another one four hours later.
The last lines in the log read FATAL ERROR: Reached heap limit Allocation failed - JavaScript heap out of
memory. Restarting fixes it every time, which is exactly why it keeps coming back.
What does "JavaScript heap out of memory" mean?
It means V8, the engine inside Node.js, reached the size limit of its heap and could not free enough memory to carry on. The limit belongs to the process, not to the machine. A server with plenty of free RAM can still hit it, because Node caps its own heap unless you tell it otherwise.
This is not an exception. You cannot catch it, and no error handler runs. It is also a server-side crash: if the red text you are looking at is in a browser console instead, you want how to fix JavaScript errors. On the server, the process writes a short report to stderr and exits:
<--- Last few GCs --->
[18342:0x5d1c3c0] 812345 ms: Mark-Compact 2041.3 (2083.1) -> 2039.8 (2083.9) MB,
1450.2 / 0.0 ms (average mu = 0.112, current mu = 0.031) allocation failure
<--- JS stacktrace --->
FATAL ERROR: Reached heap limit Allocation failed - JavaScript heap out of memoryThe garbage collector lines are worth a glance. A full collection that runs for over a second and takes the heap from 2041 MB to 2039 MB means almost everything in memory is still referenced. The collector is working as hard as it can and finding nothing to throw away.
Before anything else, check what your limit actually is, with the same Node version and flags the service uses:
node -e "console.log(require('v8').getHeapStatistics().heap_size_limit / 1048576, 'MB')"The default depends on the Node version and on how much memory the machine or container reports, so do not assume a number you read somewhere.
Is it the build or the running app?
If the crash happens during npm run build, next build, webpack or tsc, it
is a one-off job that needs more memory, and raising the limit is the right fix. If it happens in the running
server, hours or days after it started, it is almost always a leak, and raising the limit only buys time. It is
the same rule as for PHP running out of memory: memory
bounded by the work is fine, memory that grows with time or traffic is a bug.
For builds, set the flag on the job itself rather than on the production server:
NODE_OPTIONS="--max-old-space-size=4096" npm run buildIs it a leak, a spike, or the limit?
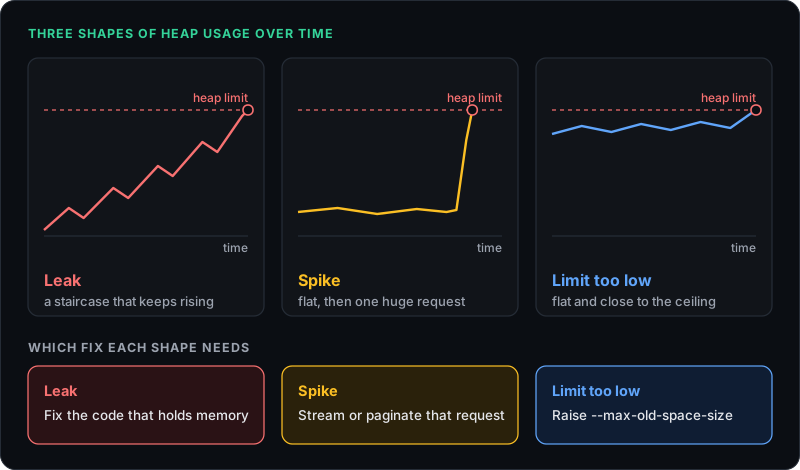
Plot heap usage over time and the shape answers it. Your platform's memory graph works, or log it yourself once a minute:
setInterval(() => {
  const m = process.memoryUsage();
  console.log('[mem] heap', Math.round(m.heapUsed / 1048576), 'MB, rss', Math.round(m.rss / 1048576), 'MB');
}, 60000).unref();- A leak looks like a staircase. Memory climbs, garbage collection takes a little back, and the floor keeps rising until the crash. The time between restarts is fairly regular and gets shorter when traffic goes up.
- A spike looks flat, then vertical. Days of normal usage, then one request takes hundreds of
megabytes at once: a large export built in memory,
fs.readFile()on a big upload, or a query with no limit that loads a million rows. - A limit set too low looks flat and high. The app always runs close to the ceiling and falls over on an ordinary busy minute. Rare, and usually seen right after a move to a smaller container.
What usually leaks in a Node.js server?
Almost every Node.js leak is something that lives as long as the process and grows a little with each request. Four patterns cover most of them.
1. A cache with no limit. A Map keyed by user, URL or query, filled on every miss
and never pruned. It is a cache in development and a leak in production. Give it a maximum size or an expiry, use
an LRU package, or move it to Redis.
2. Listeners added per request. Calling emitter.on() inside a request handler, on
an object that outlives the request. Node even warns you:
MaxListenersExceededWarning: Possible EventEmitter memory leak detected. If that warning is in your
log, treat it as the lead suspect, and do not raise the listener limit to make it go quiet.
3. Timers and closures that keep requests alive. A setInterval that is never
cleared, or a callback pushed into a module-level array, keeps everything its closure can reach. That often
includes the whole req and res objects, which are far bigger than they look.
4. Module-level collections. An array of recent errors, a metrics buffer, an in-memory session store that was meant to be temporary. Anything declared at the top of a module and appended to on each request will eventually be the biggest object in the process.
How do you find the leak with a heap snapshot?
Take two heap snapshots a few minutes of traffic apart and compare them. Whatever grew between the two and is still reachable is your leak.
On staging, start the app with node --inspect server.js, open chrome://inspect in
Chrome, and go to the Memory tab. Take a snapshot, send some realistic load at the app, then take a second one.
Switch the view to Comparison and sort by size delta. Click the top entry and read the Retainers panel: it shows
the chain of references keeping those objects alive, and the chain usually ends at your own module-level
Map or array.
In production, Node can write the snapshot for you just before it dies:
node --heapsnapshot-near-heap-limit=1 server.js
Writing a snapshot pauses the process and needs extra memory, more for bigger heaps. Turn it on for one instance
you have taken out of rotation, never across the whole fleet, and open the resulting
.heapsnapshot file in the same DevTools Memory tab.
When is raising --max-old-space-size the right fix?
Raise it when the app needs more memory for work that is legitimate and bounded, and the graph is flat. The value is in megabytes:
NODE_OPTIONS="--max-old-space-size=3072" node server.jsLeave headroom. The flag sizes the old generation of the heap only, and Node also needs memory for the young generation, Buffers, native code and its own stacks. In a container with 4 GB, about 3 GB of old space is a sensible ceiling.
How do you stop the restarts for good?
A restart policy is the safety net, not the fix. pm2's max_memory_restart recycles a process before
it crashes, which turns a hard failure into a planned restart. Keep it, and keep looking for the cause, because
every recycle also throws away the evidence.
Then put two things in place. Log memory per instance so a rising floor is visible days before it becomes a crash, and give every in-process cache a size limit. From the outside, a Node process that died on its heap looks exactly like a 502 Bad Gateway, so an alert on 502s is often the first sign you get.
The connector takes one command to install, and the Node.js setup guide walks through it step by step. If you also run a monitoring tool for traces and dashboards, keep it: the Sentry comparison explains where each one fits.
Found something wrong in here? Tell me.